Marketing Report
Last 30 Days
- Spend
- +21%
- Sales
- +19%
- Net Profit
- +12%
Looks great, right?

For leaders of online businesses (ecomm, subscription or lead generating) with $3M+ in online sales
Calib Data connects marketing measurement with customer value, business conditions and financial results, so you can build a better growth plan and learn what actually works.
Last 30 Days
Looks great, right?
Last 30 Days
A different reality.
Illustrative example, not a client result.
Explore on your own, or discuss your business with a Calib Data expert:
Initial 90-day results · 8 brands
−6.6%
Marketing spend
+14.8%
Revenue
+21.5%
Profit
Before
After 90 days
Better financial context changed where budget was allocated, not simply how performance was reported.
Aggregate observed results across eight implementations. Results vary.
Built from experience
 Abercrombie & Fitch
 Cole Haan
 Samsonite
 TUMI
 ProFlowers
 Sally Beauty
Your business has at least 1 factor. It may have all 10.
To the extent that they exist, the decisions you make from traditional marketing measurement fail to deliver the expected consequence on the P&L. While MMM, incrementality testing and third-party attribution improve marketing measurement, they don’t fully calibrate to financial impact.
Offline activity illustrated
Some channels don’t drive measurable clicks: CTV, influencers, print, etc. The lift they provide often shows up in other channels, simply because it’s a path to the website.
Most measurement tools lack a method to not only measure offline channel impact, but to calibrate both offline and online channel contribution to their impact on your P&L.
A $30,000 direct-mail campaign
Drives shoppers to search for the brand, click a Google ad, and buy.
| Metric | Before mailing | During mailing |
|---|---|---|
| Sales credited to paid search | $100,000 | $150,000 |
| Paid search spend | $10,000 | $12,000 |
| Reported paid search ROAS | 10× | 12.5× |
| Remaining rows to come (cut off in the wireframe PDF). | ||
Illustrative example, not a client result.
Customer lifetime value illustrated
An audience with stronger repeat purchasing looks weaker at checkout, but can be worth more over time.
| Metric | Audience A | Audience B |
|---|---|---|
| Acquisition ad spend | $10,000 | $10,000 |
| First-order sales | $40,000 | $30,000 |
| Reported first-order ROAS | 4× | 3× |
| Expected repeat sales within 12 months | $20,000 | $70,000 |
| Expected total 12-month sales | $60,000 | $100,000 |
| Contribution margin before acquisition ads | 50% | 50% |
| Expected 12-month profit after ads | $20,000 | $40,000 |
How Calib Data changes the decision
Value acquisition using customer economics and payback, not first-order ROAS alone.
Illustrative example, not a client result.
Many measurement systems do not separately track sales from new vs. returning customers, and show the expected sales impact over time, yet that is what impacts the P&L.
Consequently, many brands spend far too much on reengaging existing buyers, when a much higher ROI over time is available from new customer acquisition.
The software
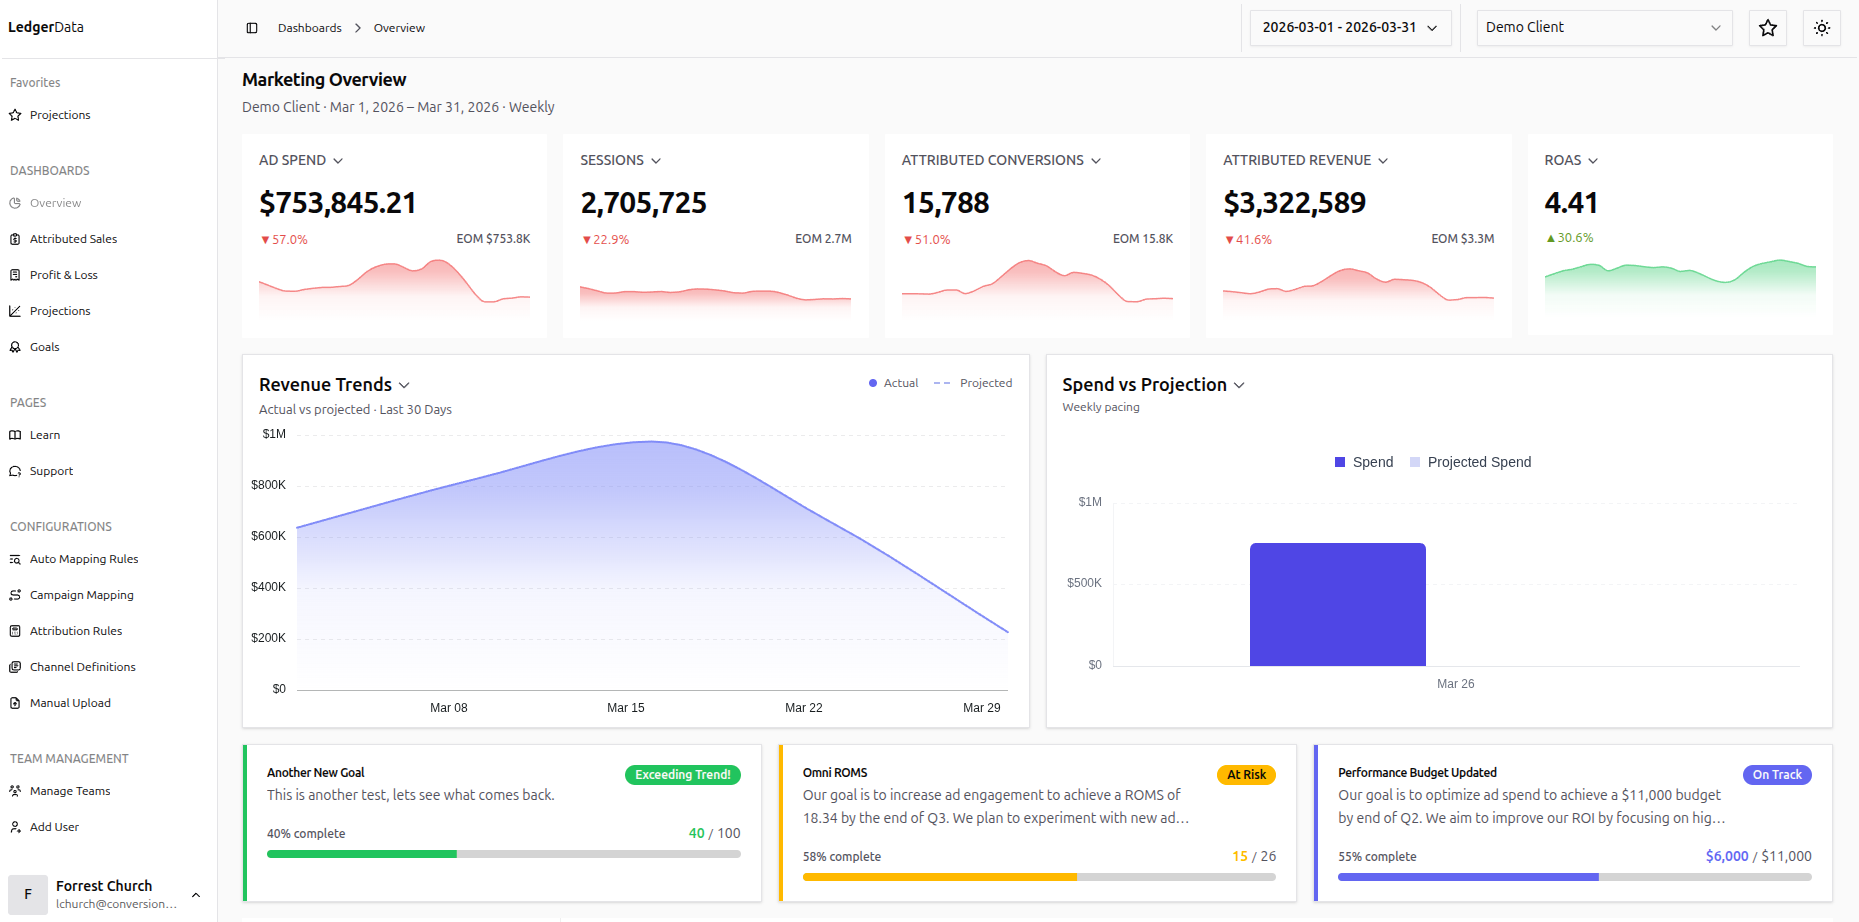
01 · Channel attribution
Ad spend, sessions, attributed revenue and ROAS, reconciled in one calibrated view. Not a stitched-together export.
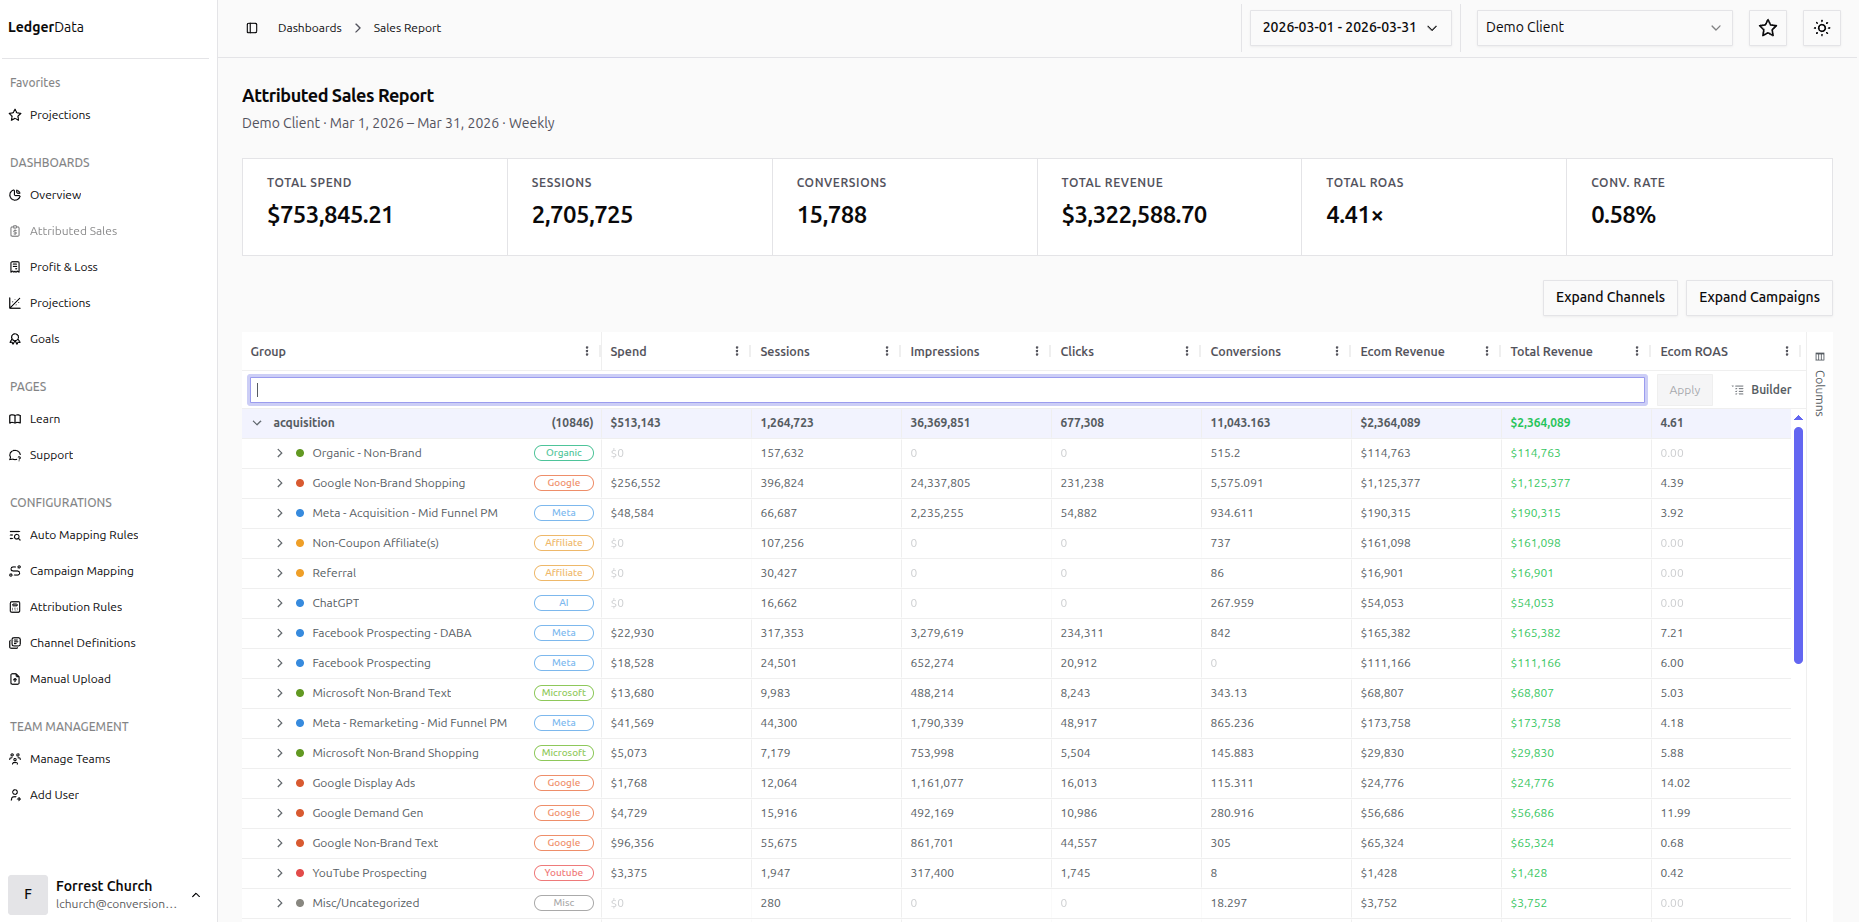
02 · Performance variance
Attribution recalibrated against finance-of-record, not last-click platform reporting. Every channel, every campaign, every week.
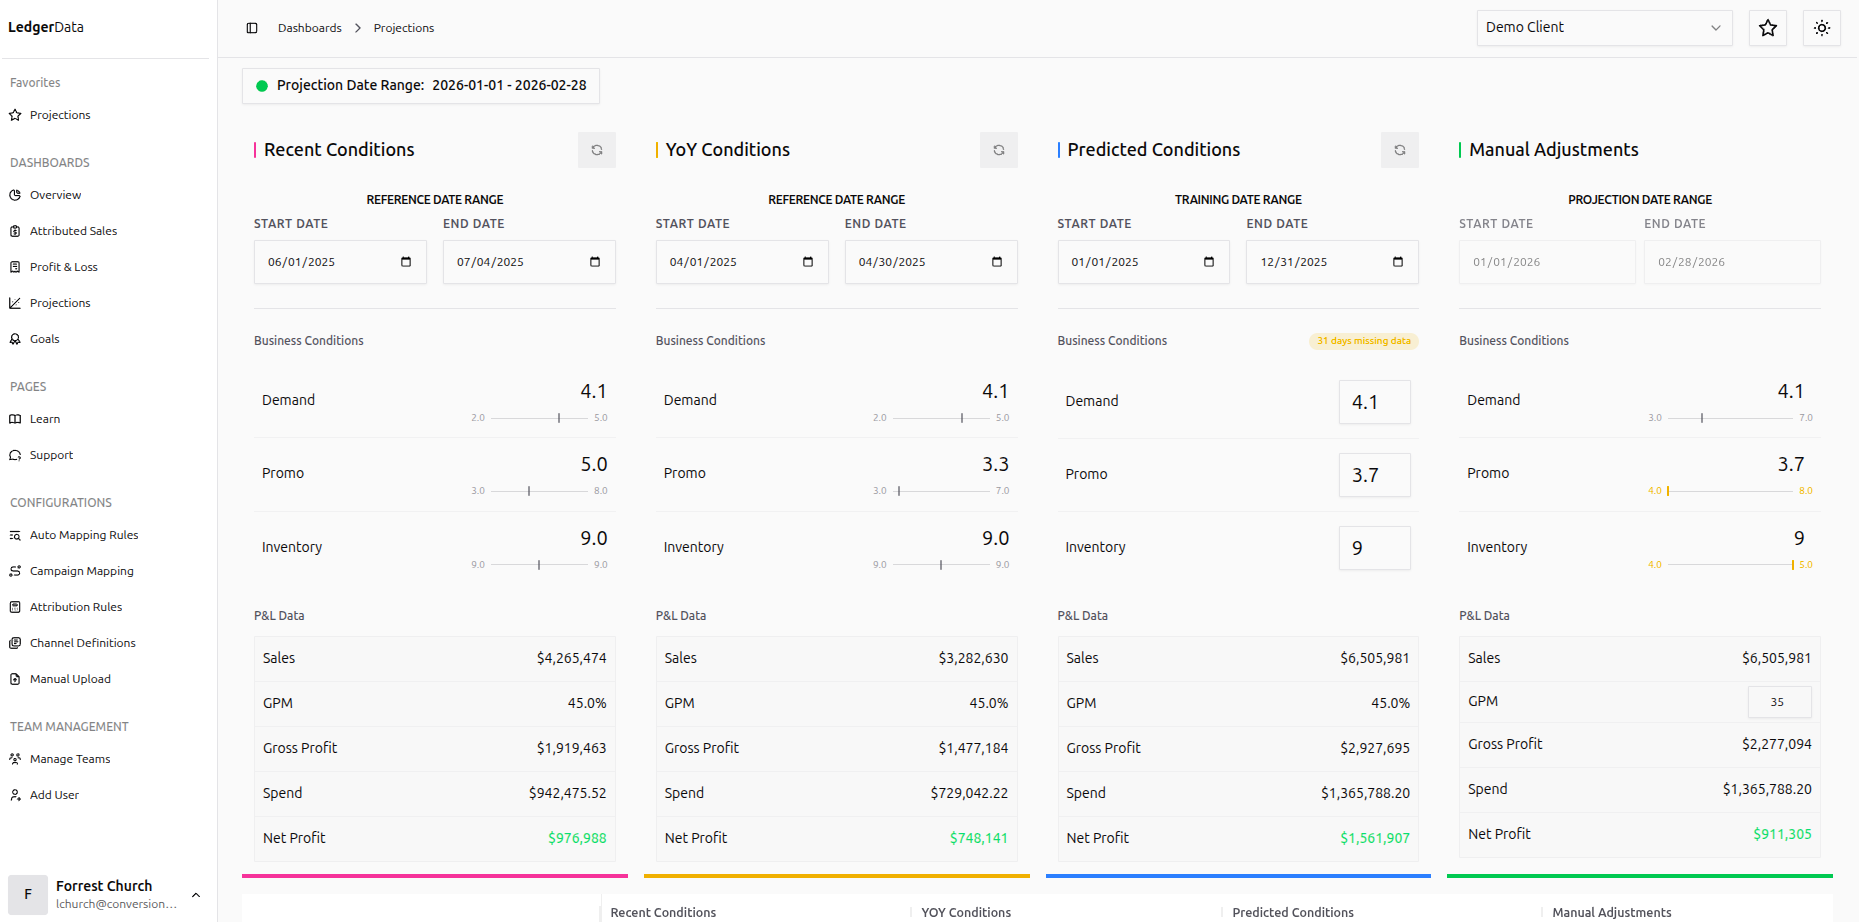
03 · Growth planning
Compare recent, year-over-year and predicted business conditions side by side, and see net profit move with each assumption.
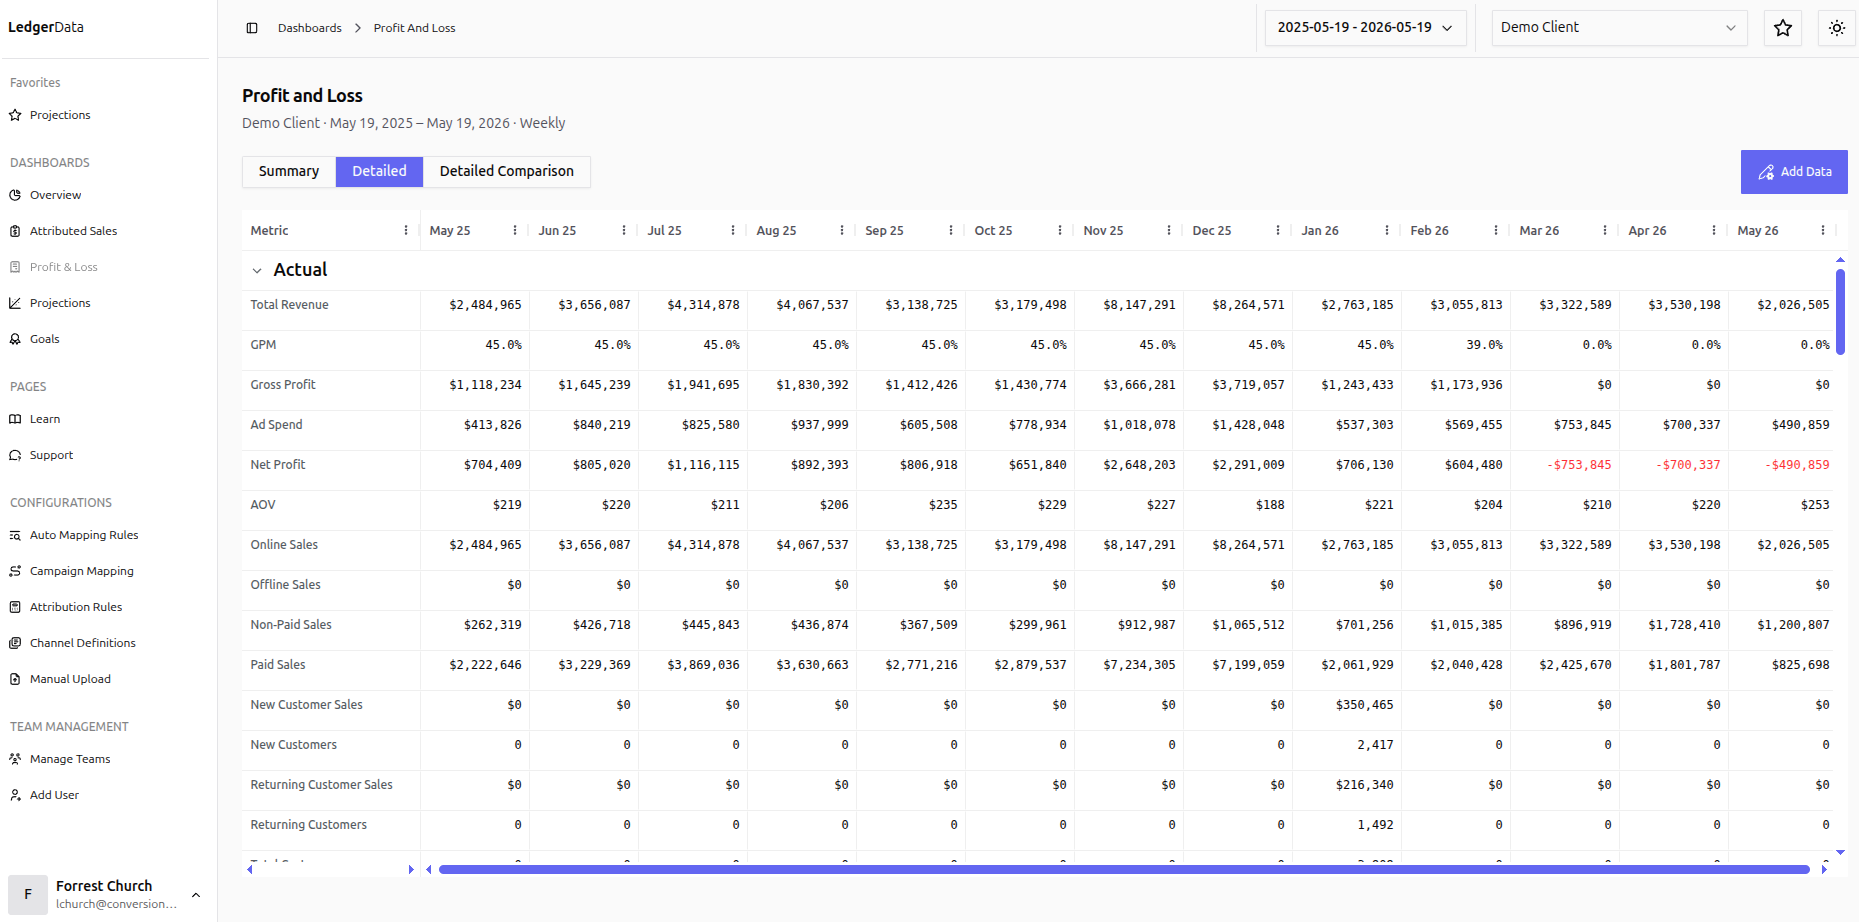
04 · Financial reconciliation
Every week’s actuals charted against plan, down to net profit and AOV. The numbers your CFO uses are the numbers your CMO sees.
05 · Customer lifetime value
Project revenue and ROAS at month 6 and at 1, 2 and 3 years. Channels rank on lifetime value, not last click.
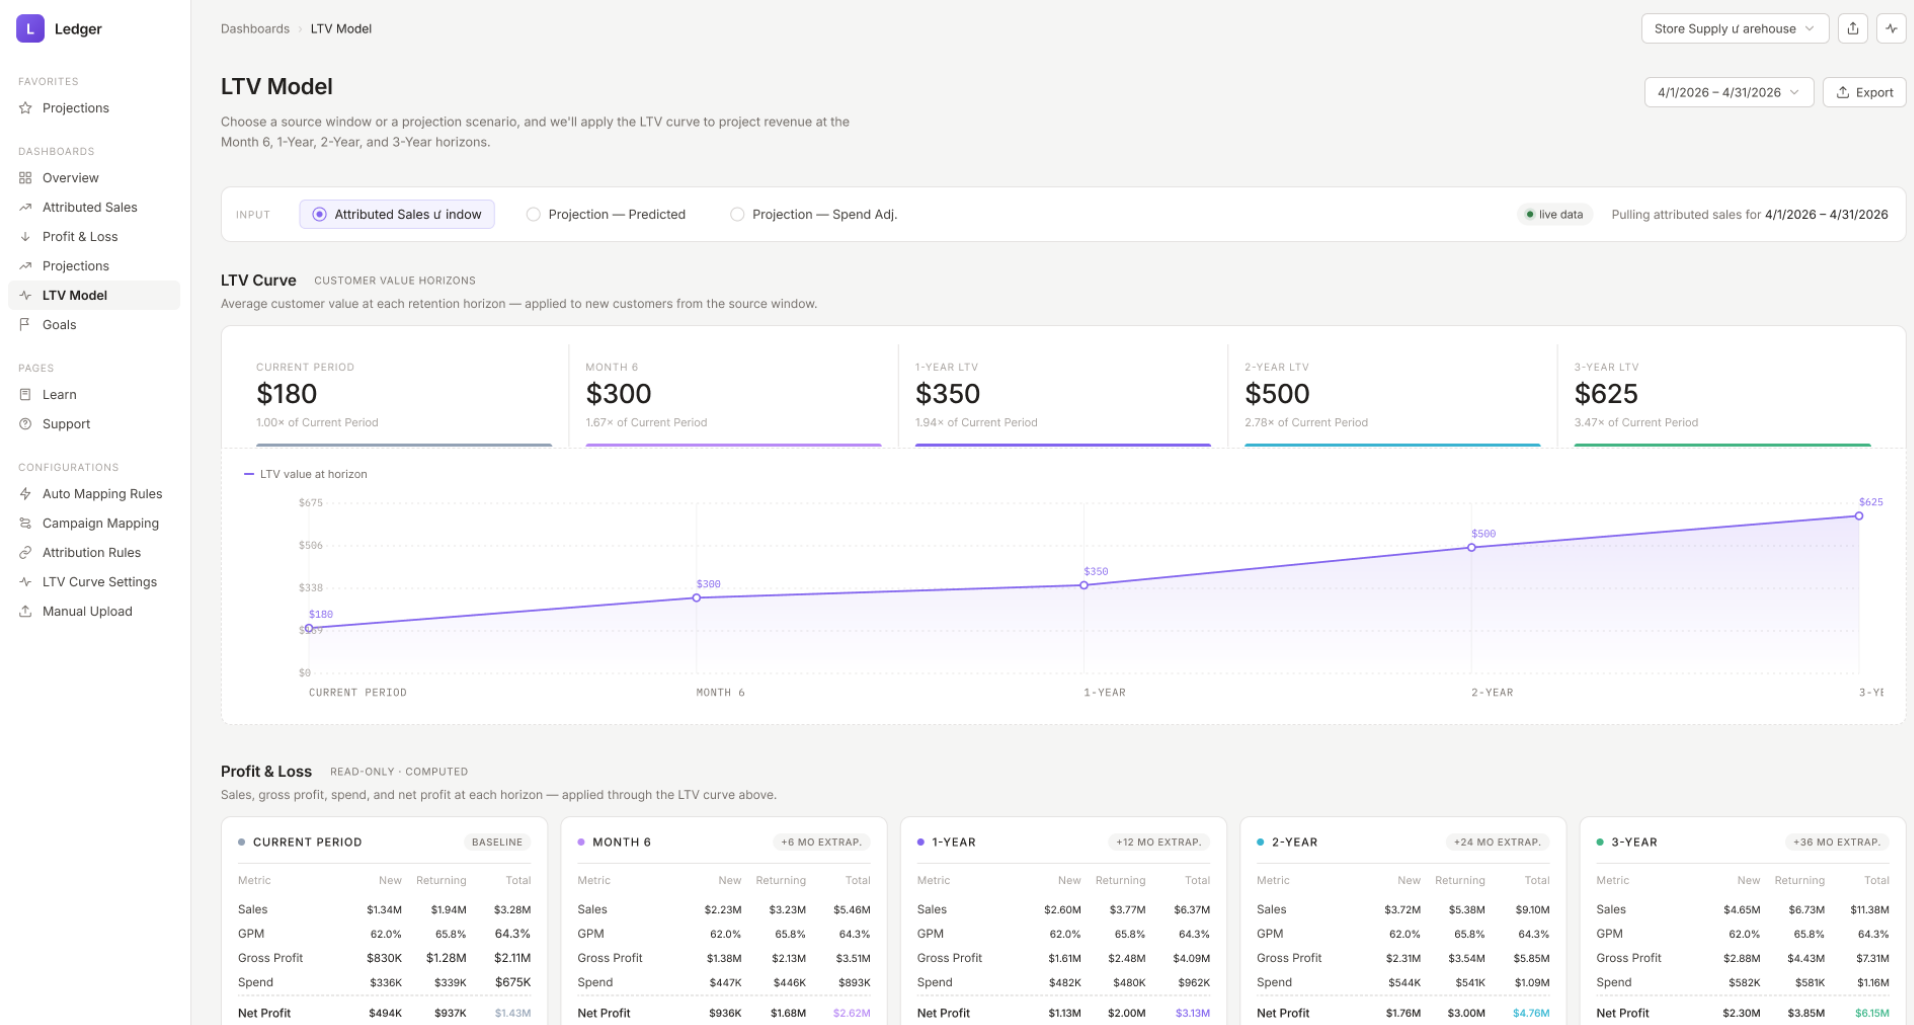
Take the 10-minute self-guided tour of the calibrated report, growth planning and the actual-versus-forecast learning process.
How it works
An interview to uncover measurement gaps. You receive a written summary of findings and how they may limit growth.
Connect marketing, business conditions and customer value in one report aligned with your P&L.
Build a growth plan with explicit, testable assumptions. Compare actual results with expectations to refine decisions.
Know what drives sales and where to invest for growth.
+21.5%
Profit increase for recent clients
Aggregate observed results across eight implementations. Results vary.
Creating demand, and proving it produced profitable growth.
Marketing background

Tom Bruce
Marketing × Finance
CFO background
The decisions your report may be getting wrong
Understand what drives sales and profit. Make a better next move.
| The decision | Before Calib Data | becomes | With Calib Data |
|---|---|---|---|
| When to scale | ROAS improved. Increase ad spend. | Check what drove the gain.Promotions and returning buyers may lift sales while discounts reduce margin. | |
| How to set budgets | Cap spend at a fixed percentage of sales. | Invest based on expected growth.Set budgets around the sales and profit investment can generate. | |
| What customers are worth | Judge returns by this period’s sales. | Include future customer value.Invest more where valuable new customers justify it. | |
| How much credit ads deserve | Paid media drove these sales. Keep spending. | Separate ad impact from other drivers.Account for promotions, inventory and loyal customer demand. | |
| Which channels to protect | Search works. CTV and print don’t. Shift budget. | Recognize demand before the click.Protect channels that fuel the sales search and retargeting capture. |
Questions before you take the next step
Financial calibration connects marketing measurement to what drives your P&L, then continually tests and improves that understanding to guide growth. It brings together marketing data and factors such as customer lifetime value, loyal customer demand, promotions, inventory, seasonality, offline activity, and margins to build a more complete explanation of performance.
That understanding becomes a growth plan: “If we make these investments, under these conditions, here’s what we expect to happen.” Comparing actual results with that plan helps test the assumptions, refine channel values, and adjust future investment.
Those tools can provide useful evidence. Calib Data brings that evidence into a broader financial model and growth plan, then compares expectations with actual business results.
No. Calib Data can support your existing team and agency with a shared view of performance and investment expectations. Though Calib Data was launched from the experience as an agency (Conversion Path), we do not solicit agency business from Calib Data clients.
We review your marketing and sales data, financial assumptions and business conditions. Setup and support are scoped to your business; Finance and Marketing participate in building the model.
It can also apply to subscriptions and businesses acquiring customers through online leads. Customer value, retention, close rates and timing shape what the model needs to include.
Your next step
Take the 10-minute self-guided Calib Data tour.
See the calibrated report, growth planning and the actual-versus-forecast learning process.
Get access now and a link by email.
Meet with a Calib Data expert for 30 minutes.
Get a brief software overview, then explore your reporting, growth planning and potential gaps.
Receive a summary of potential gaps and suggested next steps.